TikTok Shop US · Aug 2025 to Aug 2026

DTC bedding brand.
$3.08M in 12 months.

TikTok Shop US August 2025 – August 2026 Full ownership of affiliate, creator and paid growth

We owned end-to-end TikTok Shop growth for a direct-to-consumer bedding and apparel brand — building the creator affiliate engine, scaling GMV Max paid campaigns on top of it, and running the catalog and fulfilment operations that kept pace with demand. The shop grew to $3.08M in trailing-twelve-month GMV, a 414% year-over-year increase, with creator-generated content driving 84.5% of all revenue.

Headline results — trailing 12 months
$3.08M
Shop GMV
▲ 414% YoY
Aug 2025 – Aug 2026
45,516
Orders
▲ 443% YoY
Aug 2025 – Aug 2026
44,764
Customers
▲ 441% YoY
Aug 2025 – Aug 2026
51,161
Items sold
▲ 460% YoY
Aug 2025 – Aug 2026
84.5%
GMV from creators
Aug 2025 – Aug 2026
$1.95M
Creator GMV
Nov 2025 – Aug 2026
6.09
GMV Max ROI
Aug 2025 – Aug 2026
12,461
Affiliate videos
Nov 2025 – Aug 2026

Each figure is labelled with the reporting window it was measured over. Shop Analytics covers the full trailing twelve months; Affiliate Center reporting begins Nov 2025. Figures from different windows are not directly divisible into one another.

Affiliate & creator program.

Built and scaled the creator affiliate program into the brand's primary revenue channel. Over the measured window (Nov 2025 – Aug 2026):

Channel mix & attribution.

A deliberate structural outcome: revenue is powered by creators, not by brand advertising or seller-produced content.

ChannelShare of GMVDetail
Creator video12,461 affiliate short-form videos
Shop tab & adsGMV Max and product search
Creator LIVE12,521 LIVE streams
Seller contentBrand-owned posts

Catalog & operations.

What drove the result.

Tools & platforms
TikTok Shop Seller CenterTikTok Affiliate CenterGMV MaxSpark AdsTikTok Ads ManagerEUKAReacherKalo DataFastMossDiscordShopifyAmazon Seller Central
Appendix

Dashboard evidence.

Screenshots exported from TikTok Shop Seller Center. Brand identity withheld; all figures unedited.

Fig. 01Shop Analytics — Trailing 12-Month Performance
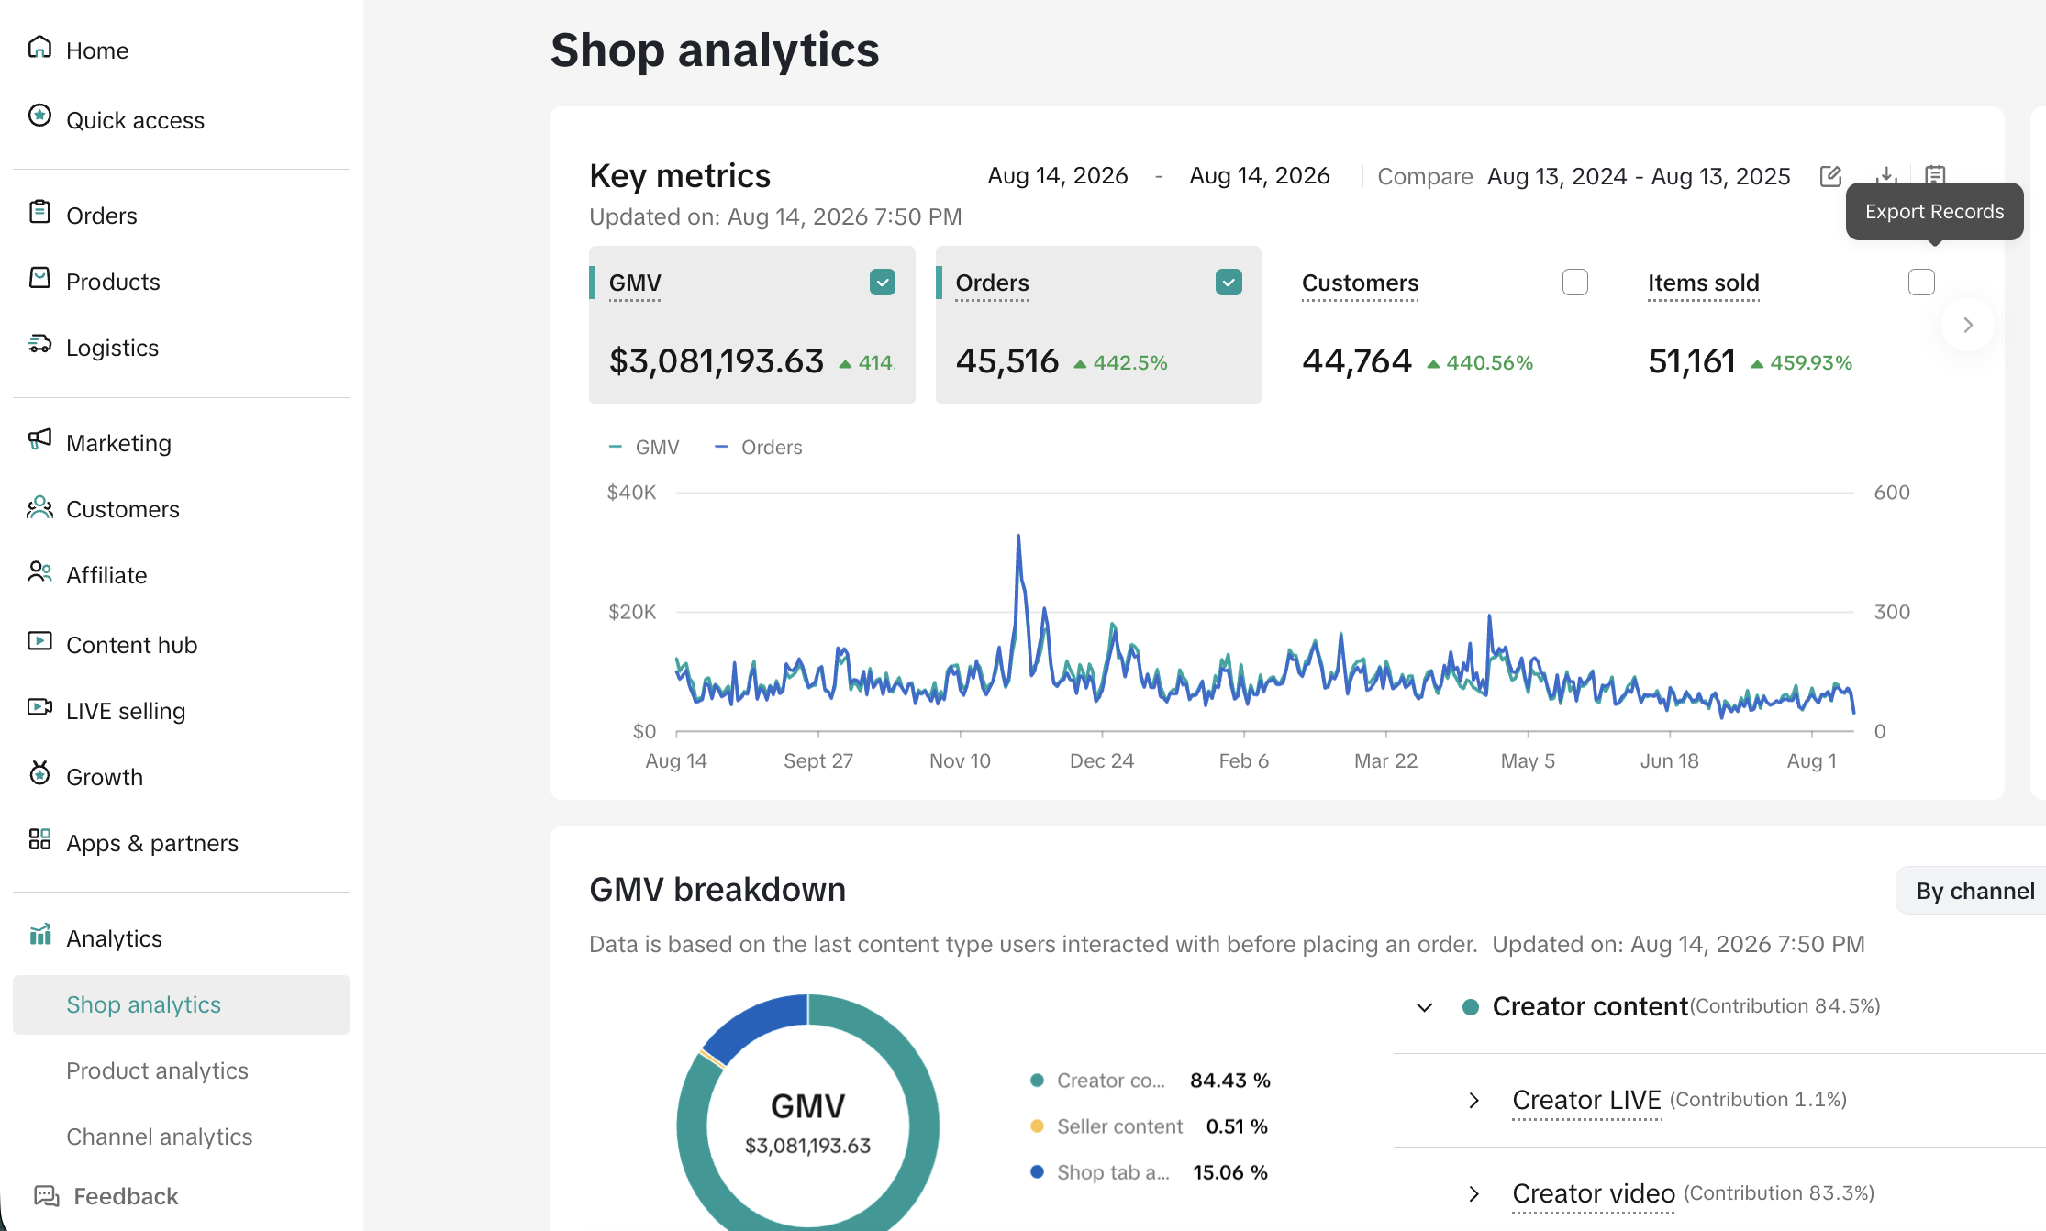
Shop Analytics — Trailing 12-Month Performance
$3,081,193.63 GMV (+414% YoY) · 45,516 orders (+442.5%) · 44,764 customers (+440.6%) · 51,161 items sold (+459.9%). GMV breakdown shows creator content at 84.5% contribution.
Fig. 02Affiliate Center — Creator-Attributed Performance
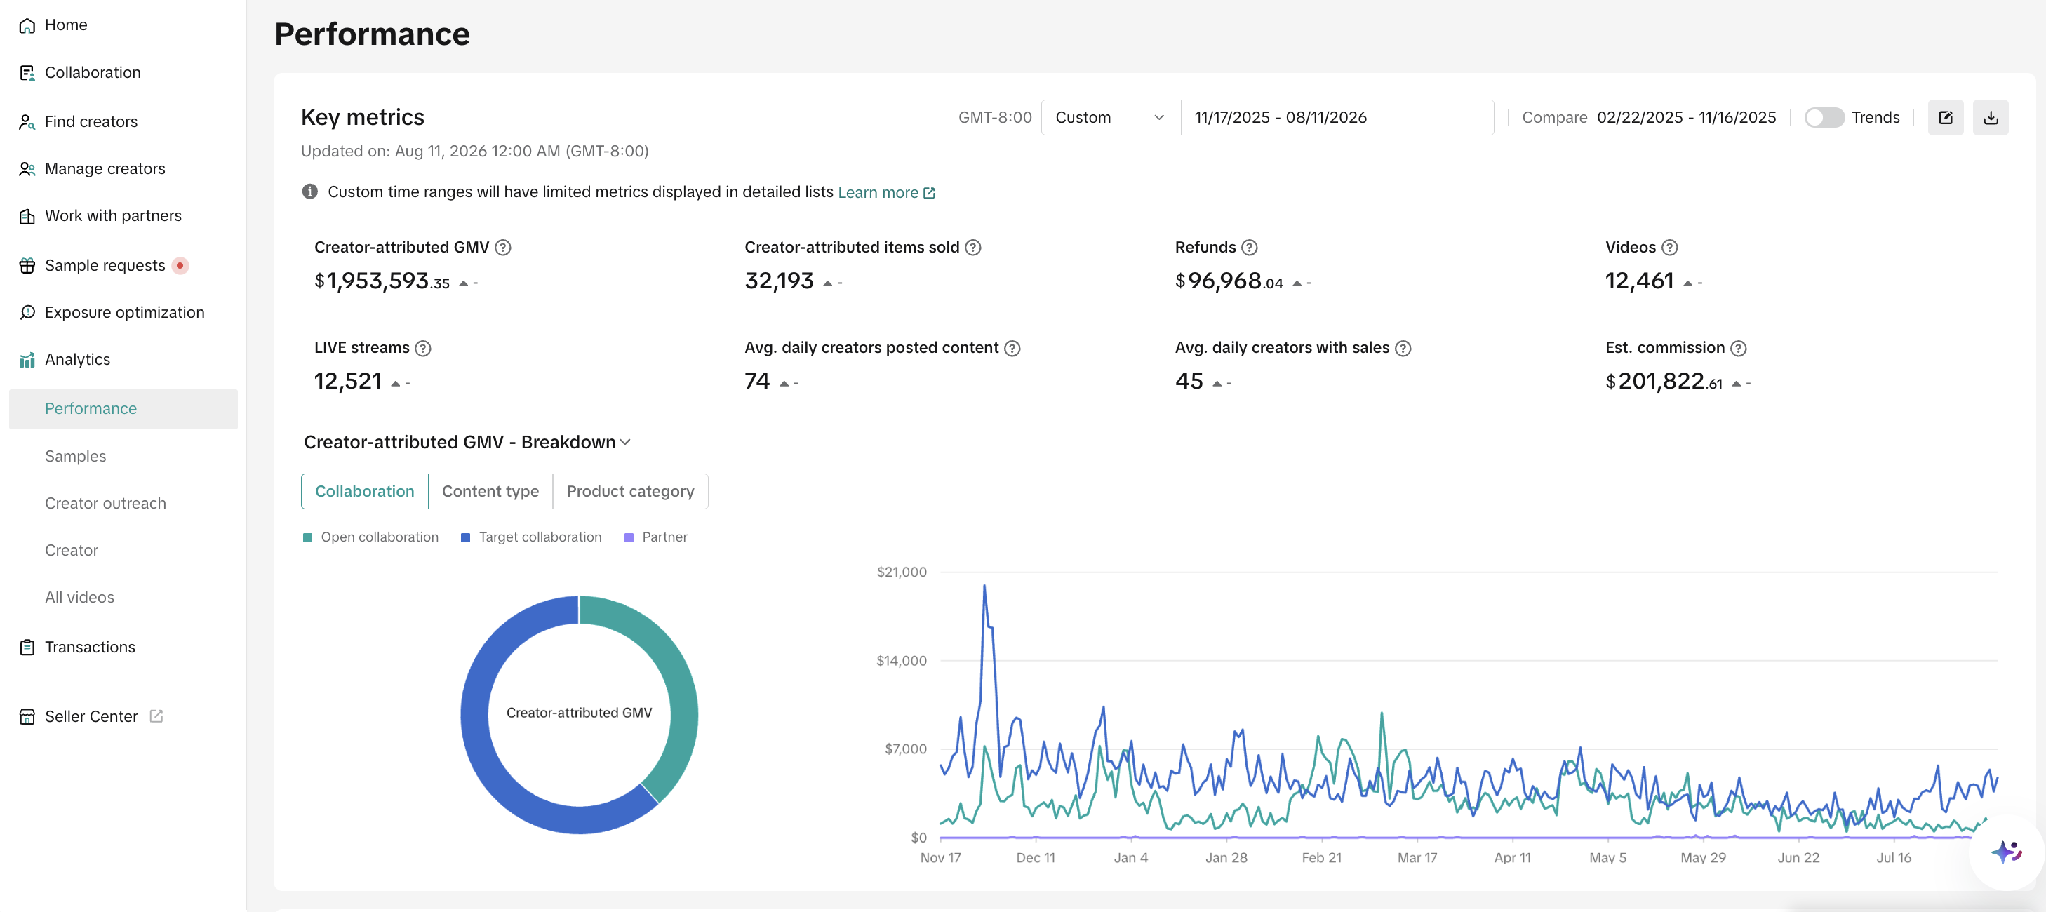
Affiliate Center — Creator-Attributed Performance
Nov 17, 2025 – Aug 11, 2026: $1,953,593.35 creator-attributed GMV · 32,193 items sold · 12,461 videos · 12,521 LIVE streams · 74 avg. daily creators posting / 45 with sales · $201,822.61 estimated commission.
Fig. 03GMV Max — Paid Campaign Performance
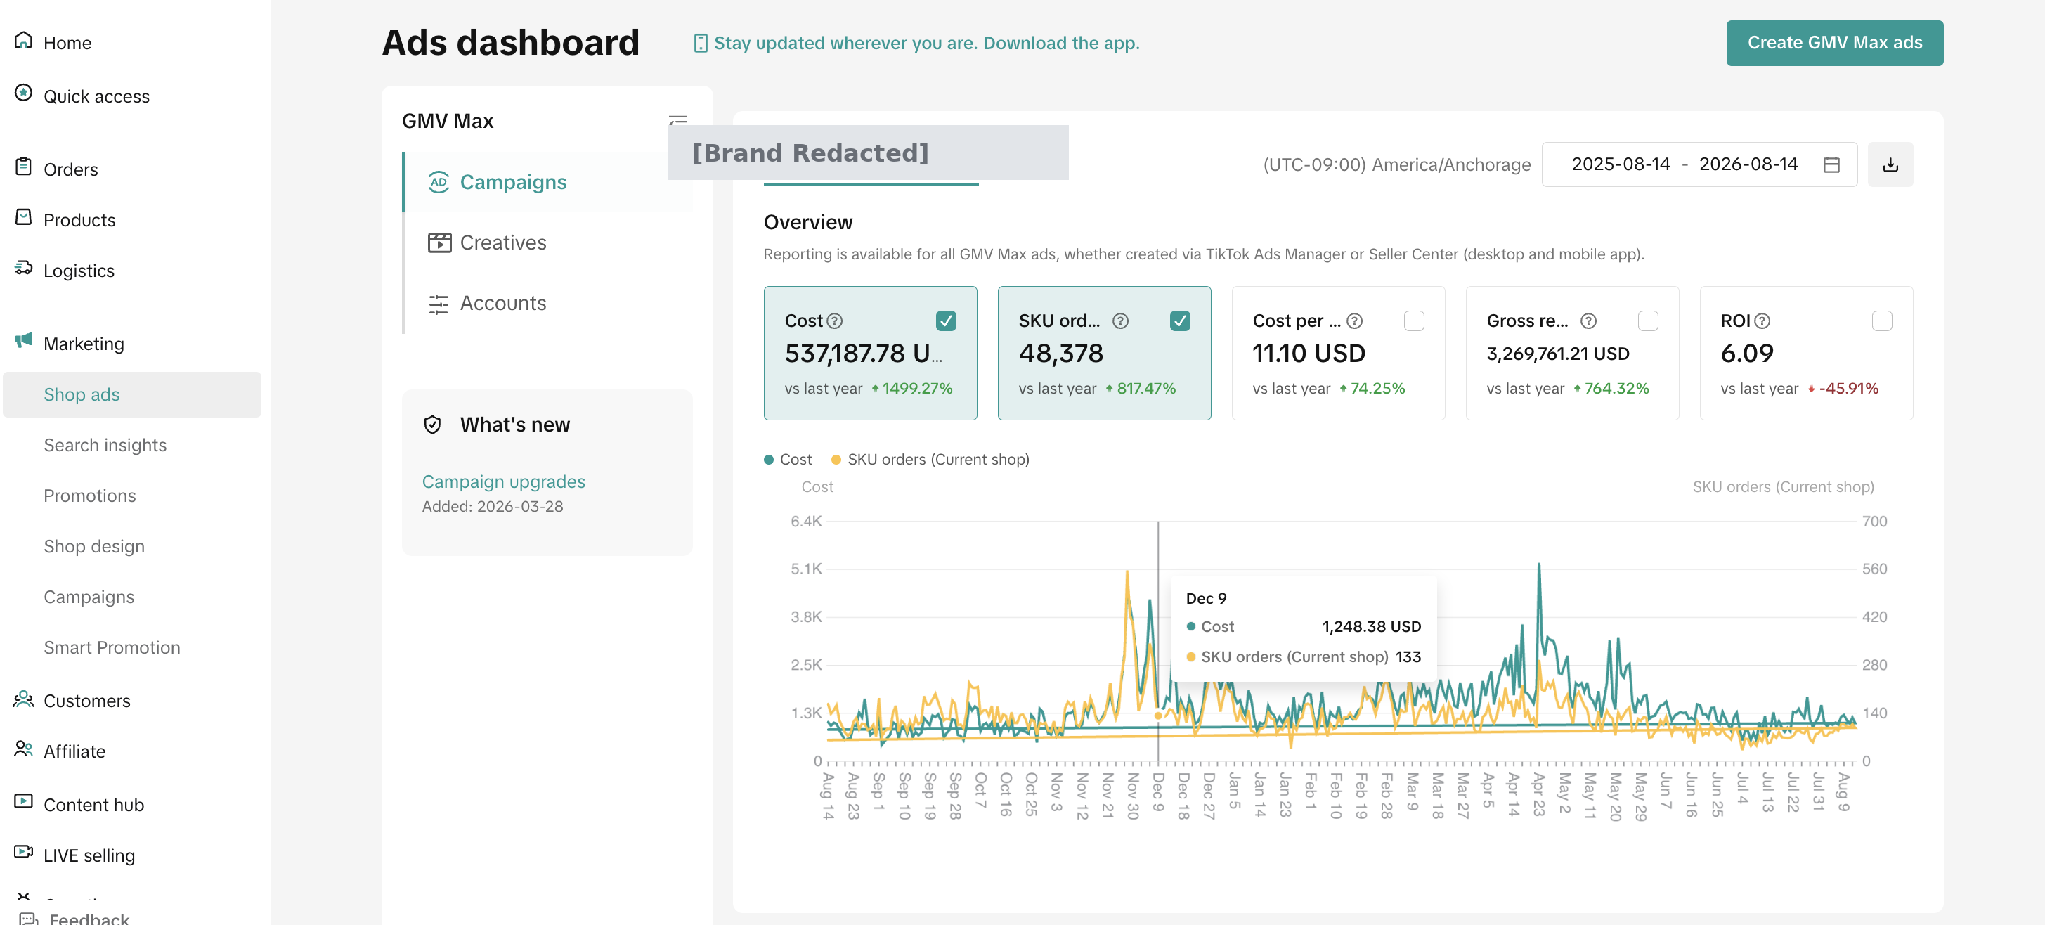
GMV Max — Paid Campaign Performance
Aug 14, 2025 – Aug 14, 2026: $537,187.78 spend (+1,499.27% YoY) · 48,378 SKU orders (+817.47%) · $11.10 cost per order · $3,269,761.21 gross revenue (+764.32%) · 6.09 ROI.
A note on attribution

Figures reflect TikTok Shop platform reporting for the periods stated. Attribution windows and date ranges differ between Shop Analytics, Affiliate Center and GMV Max reporting — figures are presented per-dashboard and are not additive across sources.